Modelling spatiotemporal variation in under-five malaria risk in Ghana in 2016–2021 | Malaria Journal
Malaria trend and transmission in Ghana
The national annual trend of malaria incidence among under-five children in Ghana based on the DHIMS2 data for 2016, 2017, 2018, 2019, 2020, and 2021 are 4,725,597, 5,077,089, 5,774,470, 6,173,507, 5,167,316, and 5,741,261, respectively, resulting in a total malaria case number of 32,659,240 over the six-year period. Notably, malaria cases increased steadily from 2016 to 2019. Although malaria cases decreased at the beginning of COVID-19 in 2020, they increased in 2021 (Table 1).
Spatiotemporal variation analysis of malaria risk
Figure 1 displays the spatial variation of SIR across the 260 districts in Ghana. The study used the same scale for the SIR of malaria morbidity for the 6 maps for better visualization and comparison. Clusters of districts with a higher risk of malaria morbidity were observed across 2016–2021 in the study. Lawra and Nandom districts in the Upper West region were identified as hotspot areas with consistently high SIR values over the 6 years. Pru East in the Bono East region consistently recorded a high risk of malaria morbidity in 2016–2019 and 2021. Additionally, Anloga, Ketu North, Ketu South districts, and Keta Municipality in the Volta region repeatedly recorded high SIR values for the 6 years. A cluster of districts such as Bole and Central Gonja in the savannah region and Kintampo North Municipality in the Bono East region with high SIR values were observed in 2016–2021.
Standardized Incidence Ratio (SIR) of malaria cases across the 260 districts in Ghana (2016–2021)
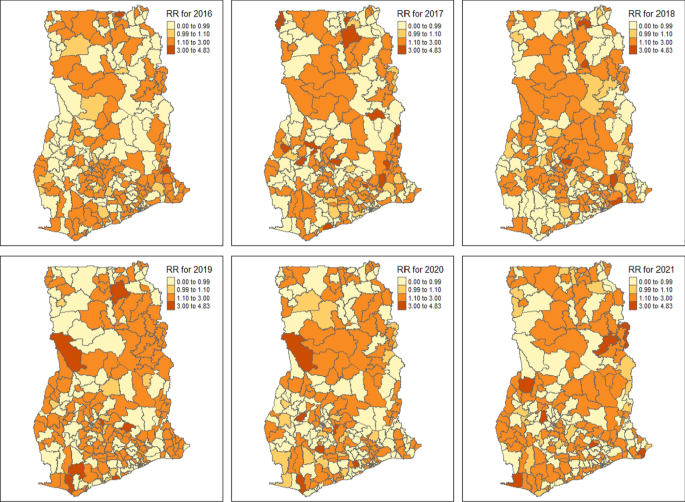
Figure 2 shows the predicted relative risk of malaria morbidity across the 260 districts in Ghana during 2016–2021. For better visualization, an interactive web-based map version of Fig. 2 is provided in Additional file 1. The average predicted malaria relative risk across all districts from 2016 to 2021 was 1.25 (95% credible interval = 1.23,1.27). The average national relative risk in 2016, 2017, 2018, 2018, 2019, 2020, and 2021 was 1.22 (95% credible interval = 1.20, 1.24), 1.28 (95% credible interval = 1.26,1.29), 1.20 (95% credible interval = 1.18, 1.22), 1.32 (95% credible interval = 1.31, 1.34), 1.20 (95% credible interval = 1.18, 1.21), and 1.27 (95% credible interval = 1.25, 1.29), respectively. The malaria risk is relatively the same over the entire year. However, the highest risk was recorded in 2019 while in the 2021 data, residing in Keta, Abuakwa South, Jomoro, Ahafo Ano South East, Tain, Nanumba North, and Tatali Sanguli districts was associated with the highest risk of malaria burden ranging from a relative risk of 3.00 to 4.83. Spatial clusters of districts with a high or low relative risk of malaria morbidity were observed throughout the six years. The relative risk of malaria in Lawra and Nandom districts in the Upper West region was higher than in the overall population in all the years except for 2020. Additionally, most districts and municipalities in the Savannah, Northern, and Bono East regions recorded a high relative risk of malaria over the entire period. The Bole district in the Savannah region consistently recorded a relative malaria risk above the standard population in 2017, 2018, and 2019. The relative risk of malaria in Kintampo was above average in 2017–2020. Notably, the Bole district was among the lowest malaria risk districts in 2016 (RR: 0.20) but became one of the highest-risk districts in 2019 (RR: 3.74) and 2020 (RR: 3.38) (Table 2).

Predicted relative risk of malaria across the 260 districts in Ghana obtained from a weighted Bayesian Hierarchical Spatio-temporal model (2016–2021). (Note: the interactive web-based version of this map is available in Additional file 2 of the online supplementary material)
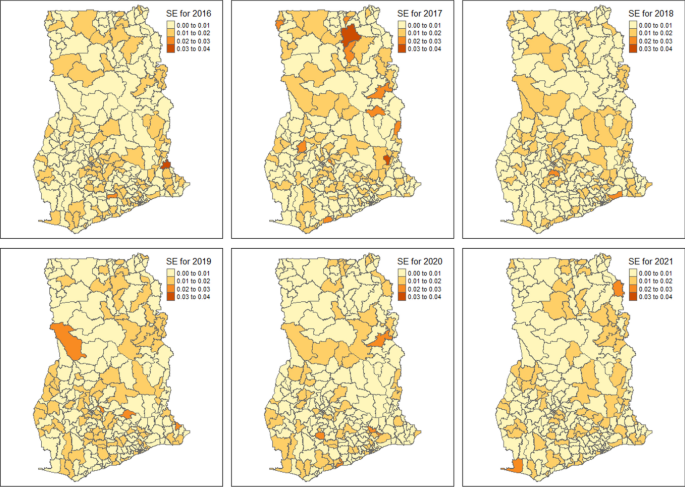
Presented in Fig. 3 are the predicted uncertainty maps associated with the Smoothed relative risk of malaria across the 260 districts in Ghana obtained from the weighted Bayesian Hierarchical Spatio-temporal model. Generally, the uncertainty associated with the predicted relative risk was very low, ranging from 0.0003 to 0.0323 across the study period. The median and mean standard errors were 0.0081 and 0.0085, respectively.

Predicted standard errors associated with the predicted relative risk of malaria across the 260 districts in Ghana obtained from the weighted Bayesian Hierarchical Spatio-temporal model
Autocorrelation function of malaria cases from 2016 to 2021
The autocorrelation plot shows weak autocorrelation of the relative risk of malaria in the districts over the six-year period (Fig. 4). This indicates that malaria cases are not highly correlated.

Autocorrelation plot of malaria cases from 2016 to 2021
The influence of children under 5 and male population on the risk of malaria morbidity
Table 3 shows the covariates associated with the risk of malaria morbidity. Both the log number of children under five years and the log number of males were not significantly associated with altered risks of malaria morbidity. For every 10% increase in the number of children under five years, malaria risk increased by 0.039 (log-mean 0.95, 95% credible interval = − 13.82–15.73) and for every 10% increase in the number of males, malaria risk decreased by 0.075 (log-mean − 1.82, 95% credible interval = − 16.59–12.95). Notably, Bayesian model selection tools such as the deviance information criterion (DIC) and Watanabe–Akaike information criterion (WAIC) scores for Model I and Model II were almost the same even though both model evaluation metrics were in favor of Model I (Table 3).
Districts with statistically significant high-high, high-low, low–high and low-low values of relative risk of malaria
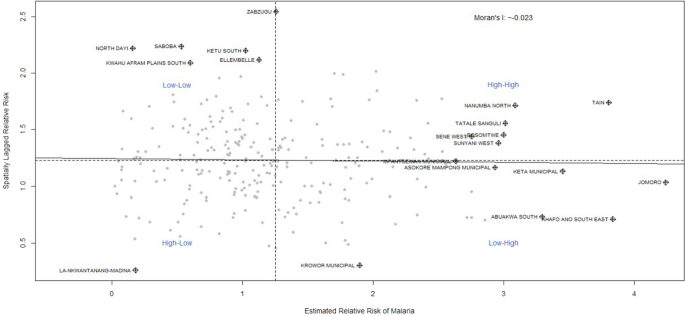
A Moran scatterplot is presented to display clusters of districts with significantly high-high, high-low, low–high, and low-low values of relative risk of malaria from 2016 to 2021. In the upper-right quadrant are districts with elevated levels of risk relative to what would have been expected in the standard population. Additionally, in the lower-left quadrant are districts with significantly lower risk than expected in the standard population (Fig. 5 and Additional file 2: Fig. S1-S5). The Moran scatterplot in Fig. 5 showed that Zabzugu, Nanumba North, Tatale Sanguli, Bosomtwe, Sene West, Sunyani West, and Tain were the districts with high-high risk of malaria in 2021. In Additional file 2: Fig. S1, 7 districts (i.e., Adaklu, Ho West, Agotime Ziope, Ho Municipal, Denkyembour, Bosomtwe, and Efia Kwesimintsim Municipal) in the upper-right quadrant were identified as having statistically significant high relative risk of malaria in 2016. This means that these districts were surrounded by neighbouring districts with high relative risk of malaria. The Additional file 2: Fig. S1 also identified Bunkpurugu Nakpanduri as the only district in the lower-left quadrant with statistically significant low values surrounded by districts with a lower risk of malaria. Additional file 2: Fig. S2 revealed that Jasikan, South Dayi, Afadzato South, Kpando Municipal, and North Dayi districts in the Volta Region recorded statistically significant clustering of high–high relative risk of malaria in 2017. Two districts, including La-Nkwantanang-Madina and Krowor Municipal, fell within the lower-left quadrant with a cluster of low-low risk of malaria in 2017. It is observed in Additional file 2: Fig. S3 that there were 11 districts with statistically significant high-high risk of malaria, while Akatsi North was identified as the only district with low-low risk of malaria in 2018. The results in Additional file 2: Fig. S4 indicated that 10 districts in the upper-right quadrant recorded a significant high relative risk of malaria, surrounded by districts with a high risk of malaria. Clusters of low-low risk of malaria were identified in South Dayi and Agona East in 2019. In 2020, clusters of high-high risk of malaria were recorded in Okere, East Gonja Municipal, Asante Akim North, Yilo Krobo, Kpando Municipal, Bole, and Adansi Akrofuom districts, while a cluster of low-low risk was identified in Dormaa East district (Additional file 2: Fig. S5).

Moran scatterplot of districts with significantly high-high, high-low, low–high and low-low values of relative risk of malaria in 2021
Spatio-temporal clustering and outliers of the risk of malaria morbidity
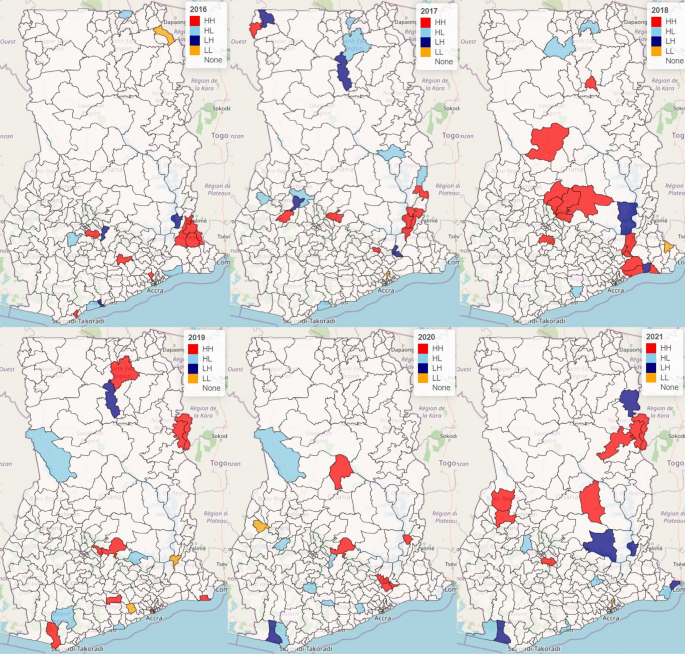
Figure 6 displays the LISA cluster map of districts with extremely high-high, high-low, low–high, and low-low significant relative risks of malaria morbidity with associated covariates from 2016 to 2021. A spatial cluster of significantly high relative risk of malaria morbidity was recorded in the Ho West, Adaklu, and Agotime Ziope districts and Ho Municipality in the Volta region in 2016. The Bosomtwe, Kwaebibirem, Ga North and Effia Kweismintsim, with a significantly high relative risk, shared a high relative risk with neighbouring districts in 2016. The year 2017 identified Lawra, Ahafo Ano North, Sekyere Kumawu, Abuakwa North, Jasikan, Kwahu Afram Plains North, South Dayi, North Dayi, Afadzato South and Kpando Municipal as hot spot districts. In 2018, a significantly high relative risk of malaria morbidity was recorded in the Nanton, Kintampo North Municipal, Ejura-Sekyedumase, Mampong Municipal, Sekyere Central, Sekyere Afram Plains North, Sekyere Kumawu, Bekwai Municipal, Asuogyaman, Lower Manya, Shai Osudoku, Ningo/Prampram and Ada East. In 2019, hotspot districts included West Mamprusi Municipal, Zabzugu, Tatale Sanguli, Asante Akim North, Sekyere East, Achiase, Nzema East, and Anloga, while in 2020, hotspot areas included Kpando, East Gonja, Asante Akim North, Okere and Yilo Krobo districts and municipalities with a significantly high relative risk of malaria morbidity. In 2021, spatial clusters of high-high relative risk of malaria morbidity were observed in Sunyani West and Tain districts in the Bono region, Bosomtwe in the Ashanti region, Sene West districts in the Bono West Region, and Nanumba North, Zabzugu and Tatale Zanguli districts in the Northern Region. It is observed that La Nkwantanang-Madina district, with a significantly low relative risk of malaria morbidity, was surrounded by its neighbours (Ga East, Adenta Municipal and Ayawaso West) with low relative risk. Bosomtwe district in the Ashanti region recorded a statistically significant high relative risk of malaria in 2016 and 2021. Asante Akim North district in the Ashanti region was identified as a hotspot area in 2019 and 2020. A statistically significant high relative risk of malaria was observed in Zabzugu and Tatale Zanguli districts in 2019 and 2021. Sekyere Kumawu district was identified as a hot spot area in 2017 and 2018. South Dayi district recorded a statistically significant high relative risk of malaria in 2017 and this dropped significantly in 2019 (Fig. 6).

LISA Cluster map showing clusters of districts with high-high (red), high-low (skyblue), low–high (navy), low-low (orange), and significant relative risk of malaria morbidity with associated covariates (2016–2021)
Crédit: Lien source


Les commentaires sont fermés.